Geography has always been an essential part of human knowledge, helping people understand the world around them. Two key fields that contribute to this understanding are Geographic Information Systems (GIS) and cartography. While they serve different purposes, both are closely related and, when used together, provide powerful tools for visualizing, analyzing, and interpreting spatial data.
In today’s increasingly data-driven world, the relationship between GIS and cartography is critical for fields ranging from urban planning to environmental science. GIS allows for the analysis and management of geographic data, while cartography transforms this data into readable, visually engaging maps. By exploring the connection between these two disciplines, we can better appreciate their roles in shaping modern geographical analysis.

Understanding GIS (Geographic Information Systems)
What is GIS?
At its core, GIS is a computer-based system used to capture, store, analyze, and visualize spatial or geographic data. This system allows users to create maps and perform analysis that can reveal patterns, relationships, and trends in a particular geographic area. GIS integrates hardware, software, and data to provide a holistic approach to understanding geographic spaces.
A typical GIS consists of five key components:
- Hardware: The physical devices (computers, GPS receivers, etc.) used to collect and store geographic data.
- Software: Programs that allow users to input, analyze, and visualize geographic information. Popular GIS software includes ArcGIS and QGIS.
- Data: Geographic information, often represented in the form of maps, satellite images, and spreadsheets containing spatial data.
- People: The analysts, scientists, and developers who work with GIS to interpret data and make decisions.
- Methods: Techniques and workflows designed to analyze spatial information effectively.
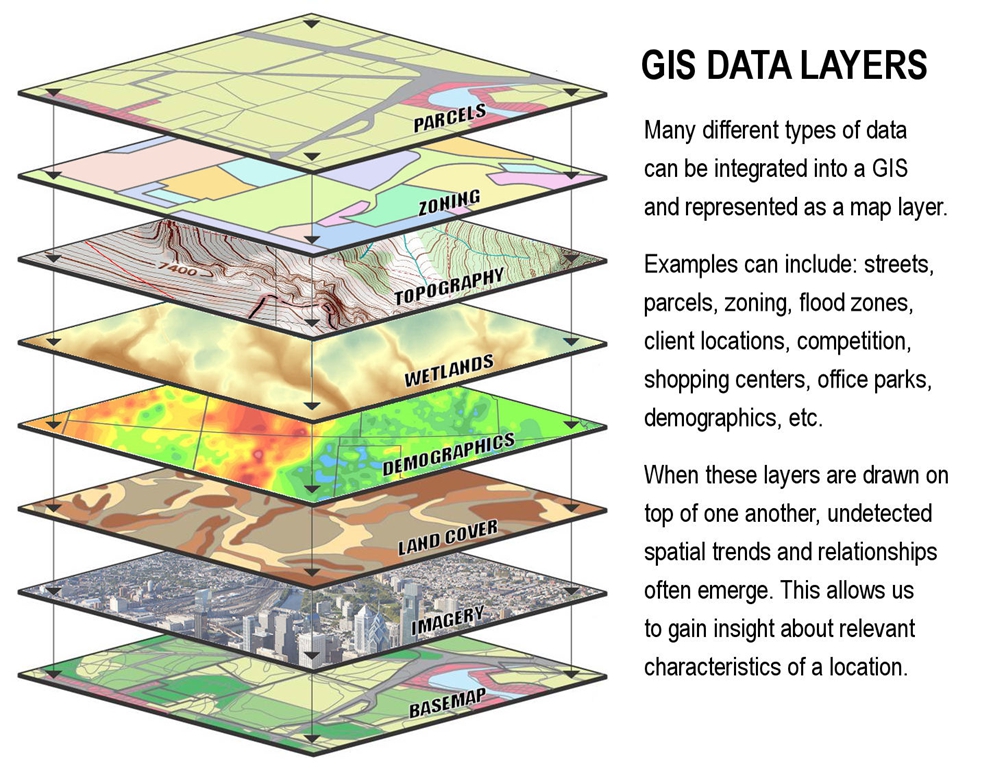
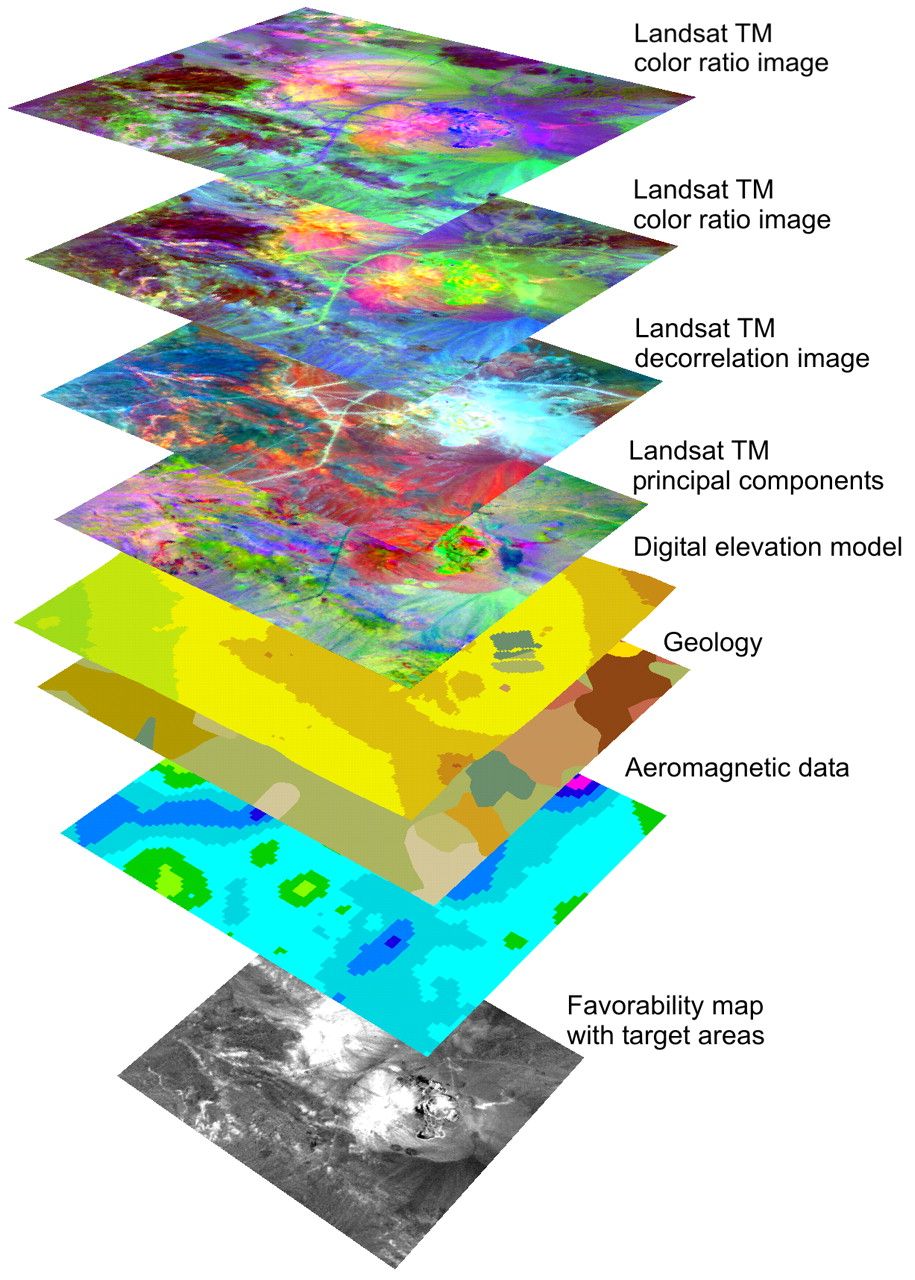
GIS systems use layers of data to represent different types of information such as roads, land use, weather patterns, and more. These layers can be stacked on top of each other to visualize complex geographic relationships. For example, a city planner might use GIS to analyze traffic patterns, population density, and green spaces to make informed decisions about future development projects.
History of GIS
The concept of GIS emerged in the 1960s when Roger Tomlinson, often called the “father of GIS,” developed the Canadian Geographic Information System to analyze land-use data. Since then, GIS technology has evolved significantly, especially with the advent of satellite imagery, global positioning systems (GPS), and cloud computing. These advancements have made GIS a critical tool in various industries, from agriculture to disaster management.
Core Functions of GIS
The primary functions of GIS can be broken down into three major categories:
- Data Capture and Management: GIS systems can import a variety of spatial and non-spatial data formats. Whether it’s coordinates from a GPS or demographic data from a census, GIS tools organize and manage this information.
- Spatial Analysis and Modeling: This is where the real power of GIS lies. By analyzing geographic data, users can create models that predict future outcomes, identify risks, or assess the impact of a specific project.
- Visualization: Once the data is analyzed, GIS allows for the creation of maps, charts, and other visual outputs that help communicate complex geographic patterns in a more understandable way.
GIS is used extensively in many fields, including urban planning, environmental management, and transportation. It allows decision-makers to visualize and analyze spatial data to make more informed choices.

What Is Cartography?
Definition of Cartography
Cartography is the practice and science of creating maps to represent geographic spaces. While GIS focuses on data collection and analysis, cartography is concerned with the visual representation of this data. Essentially, cartography is the process of designing maps that are both functional and aesthetically pleasing, ensuring that geographic information is communicated clearly and effectively.
Maps have been used for centuries to help people navigate and understand their surroundings, but modern cartography has evolved into a more sophisticated field. Today’s cartographers combine art, science, and technology to create maps that not only display geographic features but also convey complex data in a visually understandable way.
Key Elements of Cartographic Design When creating maps, cartographers must consider several factors to ensure clarity and usability. The following are core elements of effective cartographic design:
- Scale: This refers to the relationship between the distance on a map and the actual distance on the ground. For example, a map with a scale of 1:10,000 means that one unit on the map represents 10,000 units in reality.
- Projection: Earth is a three-dimensional object, but maps are two-dimensional. A map projection is the method used to represent the 3D surface of Earth on a flat plane. Different projections (e.g., Mercator, Robinson) serve different purposes and may distort certain areas depending on the type.
- Symbols: Maps use symbols to represent physical objects (like mountains or rivers) or abstract concepts (like population density). These symbols must be intuitive and easy to understand.
- Color: Colors are used to differentiate features or represent data ranges, such as elevation, temperature, or political boundaries.
- Legend: The legend explains the symbols and colors used on the map, acting as a key for interpretation.
Historical Background of Cartography
The history of cartography can be traced back thousands of years. Ancient civilizations, such as the Greeks, Egyptians, and Chinese, were among the first to create maps for navigation and territorial understanding. One of the earliest known maps, dating back to around 600 BC, was created in Babylon and depicted the world as a flat disk surrounded by water.
During the Age of Exploration in the 15th and 16th centuries, cartography became critical for navigating oceans and discovering new lands. Explorers like Christopher Columbus and Ferdinand Magellan relied heavily on maps, which were often drawn with limited knowledge but gradually improved as new territories were charted.
The advent of printing technology in the 16th century revolutionized cartography, making maps more accessible and standardized. However, it was not until the 20th century that the field underwent its next major transformation with the rise of aerial photography and satellite imaging. These technological advances allowed cartographers to create highly accurate maps with a level of detail previously impossible to achieve.
Modern Cartography
Today, cartography has been revolutionized by digital technology, allowing for the creation of dynamic, interactive maps that can be updated in real time. Unlike traditional paper maps, modern cartographic tools enable the layering of data and the customization of maps for different purposes. This shift has also led to the widespread use of GIS technologies in cartographic practices.
Modern maps are no longer static representations; instead, they can respond to user inputs, zoom in or out, and present different data layers based on the user’s needs. This capability is especially important for areas like navigation (e.g., Google Maps), environmental monitoring, and urban planning, where maps must reflect current conditions and be adaptable to various use cases.
Cartography, while often viewed as an art form, has become an indispensable tool in many industries, providing an essential visual interface for the vast amounts of data analyzed by systems like GIS.

The Intersection of GIS and Cartography
How GIS and Cartography Work Together
While GIS and cartography have distinct roles, their integration is crucial for making geographic data both functional and understandable. GIS is a powerful tool for gathering, analyzing, and storing spatial data, but this data would be of limited use without proper visualization. This is where cartography comes in: it transforms GIS data into maps that can be easily interpreted by users, whether they are city planners, environmental scientists, or the general public.
A GIS can analyze massive datasets, such as traffic patterns, weather conditions, or land use, but it is through cartography that these complex datasets are visually communicated. Without the careful design principles of cartography—such as the use of appropriate symbols, scales, and colors—the information in GIS could be overwhelming or difficult to interpret.
For example, a GIS may provide data about population density, but without cartographic input, the map may appear cluttered or misleading. By applying cartographic principles, the data can be displayed in a clear, understandable format, highlighting key trends and patterns in population distribution.
Key Differences Between GIS and Cartography
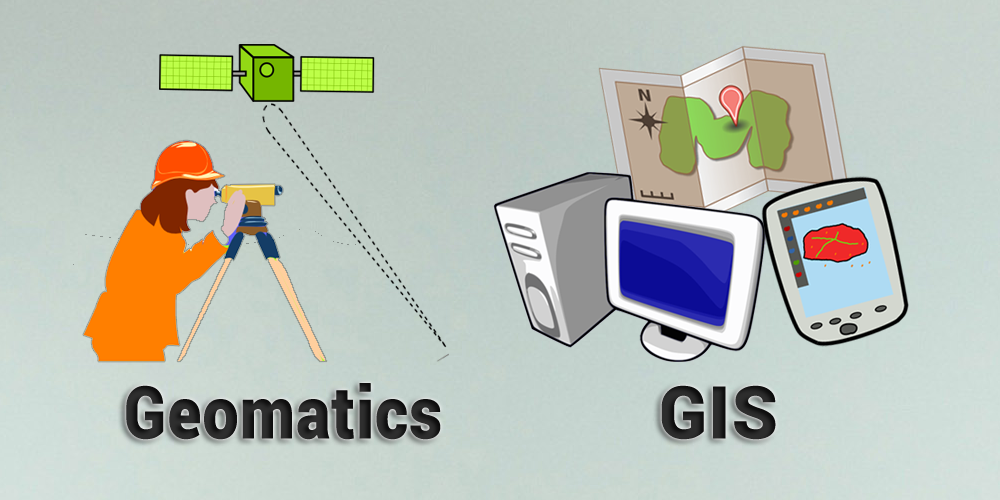
While GIS and cartography often work in tandem, it is essential to recognize their differences. The primary difference is that GIS is a data-driven tool used for spatial analysis, while cartography is the visualization of that data.
- GIS focuses on the collection and analysis of spatial data, enabling users to identify patterns, model scenarios, and make decisions based on geographic information. This makes GIS critical for data-heavy industries such as urban planning, agriculture, and transportation.
- Cartography, on the other hand, focuses on the communication of spatial data. It is concerned with the presentation of data, ensuring that maps are not only accurate but also readable and aesthetically pleasing. Cartographers consider aspects like map readability, user interface, and the effective use of visual symbols.
In short, while GIS handles the technical side of geographic data, cartography deals with how this data is presented. Both fields are necessary for turning raw geographic data into useful information that can inform decision-making processes.
The Role of Cartography in GIS
Cartographic design is critical to the effectiveness of GIS outputs. Without thoughtful design, even the most accurate GIS data can be misrepresented or misunderstood. Good cartography ensures that the maps produced by GIS are not only accurate but also clear, concise, and easy to interpret.
Consider the case of disaster management: during a flood or earthquake, accurate geographic data is essential for directing resources and coordinating response efforts. However, if this data is not presented in a clear and timely manner, it may not be useful to emergency responders. Cartography ensures that the GIS data is mapped in a way that responders can quickly understand the situation and act accordingly.
Examples of Good vs. Poor Cartographic Design in GIS Outputs:
| Good Cartography | Poor Cartography |
|---|---|
| Appropriate use of color gradients to represent different data levels | Overuse of colors that confuse the user or make distinctions unclear |
| Clear, readable labels for important locations | Overlapping or missing labels |
| Intuitive symbols for geographic features (e.g., rivers, roads) | Misleading or unclear symbols that obscure the meaning of the data |
| Proper use of scale and projection | Incorrect or distorted map projections that skew geographic relationships |
GIS and cartography are two sides of the same coin—GIS provides the data, and cartography ensures that data is presented in a way that makes sense. Their relationship is symbiotic, as cartographers need the data from GIS to create meaningful maps, and GIS users rely on cartographic principles to convey their findings effectively.

Applications of GIS and Cartography in Real-World Scenarios
The relationship between GIS and cartography is evident in many industries where geographic data must be analyzed and communicated effectively. By combining the data analysis power of GIS with the visual clarity of cartography, professionals can make informed decisions in areas like urban planning, environmental management, disaster response, and transportation.
Urban Planning and Development
Urban planners rely heavily on GIS and cartography to create effective maps for city planning and infrastructure development. In this field, GIS is used to analyze data such as population density, traffic patterns, and land use. Cartography then transforms this complex data into maps that can be easily understood by decision-makers, engineers, and the public.
For example, a city planner might use GIS to assess the best locations for new parks or schools by analyzing demographic data. The results would be displayed on a map that shows how different areas of the city are currently being used and where there may be gaps in public services. This allows for more informed decision-making about where new developments should occur.
In urban planning, cartography also plays a critical role in presenting data to the public, ensuring that maps are easy to read and communicate the planner’s intentions clearly. Maps that are poorly designed can lead to misunderstandings or opposition to projects, while well-designed maps foster public engagement and support.
Environmental Science and Conservation
GIS and cartography are essential tools in environmental science and conservation efforts. Environmental scientists use GIS to analyze ecosystems, track wildlife populations, and monitor changes in land use over time. Cartography, in turn, helps present this data in a way that highlights important environmental trends and issues.
For instance, conservationists might use GIS to map deforestation in a tropical rainforest. By layering data on tree cover, wildlife habitats, and human activity, they can create a comprehensive view of the region’s environmental health. A well-designed map can show where deforestation is occurring most rapidly and which areas are most in need of protection.
Case Study: Deforestation Monitoring in the Amazon
In the Amazon rainforest, organizations like the Amazon Conservation Team use GIS to track deforestation and illegal logging activities. By combining satellite imagery with on-the-ground reports, GIS provides a detailed view of where forests are being cleared. Cartographers then create maps that highlight deforestation hotspots, which are shared with governments and conservationists to guide protection efforts.
Disaster Management
In times of natural disasters, such as floods, earthquakes, or hurricanes, GIS plays a pivotal role in disaster management by providing real-time data on affected areas. Cartography, on the other hand, is critical for turning this data into clear, actionable maps that emergency responders can use to direct resources and coordinate relief efforts.
For example, during a hurricane, GIS systems can track the storm’s movement, predict its path, and identify which areas are most at risk. Cartographers then create maps that show evacuation routes, shelter locations, and areas prone to flooding. These maps are distributed to first responders and the public, helping to save lives and minimize damage.
Case Study: Hurricane Katrina Response
In 2005, during Hurricane Katrina, GIS and cartography were used extensively to aid in disaster response. Emergency teams relied on GIS to track the storm’s progress and assess which neighborhoods were most at risk for flooding. Cartographers created detailed maps showing the hurricane’s projected path, evacuation zones, and flood-prone areas. These maps were essential for directing rescue operations and informing the public.
Transportation and Navigation
Modern transportation systems are highly dependent on GIS and cartography for route planning, logistics, and navigation. GPS technology uses GIS to provide real-time location data, and cartography ensures that this data is displayed in a clear and navigable format.
For example, Google Maps uses GIS to analyze traffic conditions, road networks, and user-generated data to provide accurate route suggestions. Cartographic design then presents this information in a simple, user-friendly map, allowing users to navigate efficiently.
Transportation Logistics
In the logistics industry, companies use GIS to optimize delivery routes, track shipments, and reduce transportation costs. Cartographers help design maps that show the most efficient routes, taking into account factors such as road conditions, weather, and traffic.